
Abaqulusi
Quick Fact
About 30 percent of the area is tribal or traditional.
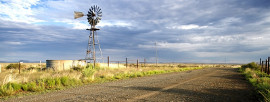
AbaQulusi Municipality is located in the northern part of KwaZulu-Natal and is approximately 1943 km2 in extent and has a population of about 211 060 people. It constitutes about 13.13% of the Zululand District Municipality, and is one of the five local municipalities that make up the district.
| Rank view all | ||
|---|---|---|
| Steve Tshwete , Mpumalanga | 229,831 | 41 |
| uMlalazi , KwaZulu-Natal | 213,601 | 42 |
| Greater Letaba , Limpopo | 212,701 | 43 |
| Abaqulusi , KwaZulu-Natal | 211,060 | 44 |
| Matatiele , Eastern Cape | 203,843 | 45 |
| Merafong City , Gauteng | 197,520 | 46 |
| Nongoma , KwaZulu-Natal | 194,908 | 47 |
Quick Fact
AbaQulusi dependency ratio was 70,5% – Census 2011.
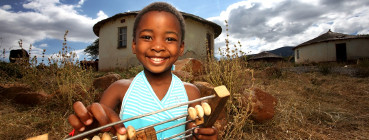
AbaQulusi serves a largely rural community with low income levels that are more severely affected by conditions of poverty than urban communities are. The families have mostly women as interim heads of household and very high dependency levels marginalise these families even more. The challenge lies in implementing appropriate community upliftment and empowerment programmes to create an environment where people can meet there basic needs and improve their quality of life.
| Group | Percentage |
|---|---|
| Black African | 95,4% |
| Coloured | 0,5% |
| Indian/Asian | 0,4% |
| White | 3,5% |
| Other | 0,1% |
| Age | Males | Females |
|---|---|---|
| 0-4 | 6,4% | 6,4% |
| 5-9 | 6,1% | 5,9% |
| 10-14 | 6,1% | 5,8% |
| 15-19 | 6,1% | 5,9% |
| 20-24 | 4,8% | 5% |
| 25-29 | 4% | 4,4% |
| 30-34 | 2,9% | 3,2% |
| 35-39 | 2,4% | 2,7% |
| 40-44 | 1,8% | 2,4% |
| 45-49 | 1,6% | 1,6% |
| 50-54 | 1,4% | 2,1% |
| 55-59 | 1,3% | 1,8% |
| 60-64 | 1% | 1,4% |
| 65-69 | 0,6% | 0,9% |
| 70-74 | 0,5% | 0,8% |
| 75-79 | 0,3% | 0,6% |
| 80-84 | 0,2% | 0,4% |
| 85+ | 0,2% | 0,3% |
| Language | Percentage |
|---|---|
| Afrikaans | 2,9% |
| English | 2,4% |
| IsiNdebele | 1% |
| IsiXhosa | 0,1% |
| IsiZulu | 89,2% |
| Sepedi | 0,2% |
| Sesotho | 0,7% |
| Setswana | 0,5% |
| Sign Language | 0,2% |
| SiSwati | 0,1% |
| Tshivenda | 0% |
| Xitsonga | 0,1% |
| Other | 0.4% |
| Not Applicable | 2,2% |
| Group | Percentage |
|---|---|
| Married | 14,8% |
| Living together like married partners | 3,8% |
| Never married | 78,5% |
| Widower/Widow | 2,2% |
| Separated | 0,4% |
| Divorced | 0,3% |
| Group | Percentage |
|---|---|
| No Schooling | 3,3% |
| Some Primary | 46% |
| Completed Primary | 6,1% |
| Some Secondary | 30,5% |
| Completed Secondary | 11,4% |
| Higher Education | 0,7% |
| Not Applicable | 2% |
| Sex | Percentage |
|---|---|
| Female | 52,4% |
| Male | 47,6% |
Quick Fact
72,1% Use electricity for lighting.

Access to piped water and electricity has increased over the past years. Less than half of the total households had access to flush toilet in 2011.
| Area | Percentage |
|---|---|
| Urban | 39,1% |
| Tribal/Traditional | 32,7% |
| Farm | 28,2% |
| Item | Yes | No |
|---|---|---|
| Cellphone | 89,4% | 10,6% |
| Computer | 11,3% | 88,7% |
| Television | 63,8% | 36,2% |
| Satellite Television | 17,4% | 82,6% |
| Radio | 74,9% | 25,1% |
| Landline / Telephone | 7,5% | 92,5% |
| Motor Car | 21,4% | 78,6% |
| Refrigerator | 56,7% | 43,3% |
| Electric / Gas-Stove | 63,2% | 36,8% |
| Energy Source | Cooking | Heating | Lighting |
|---|---|---|---|
| Electricity | 62% | 45,7% | 72,1% |
| Gas | 3,3% | 1,7% | 0,2% |
| Paraffin | 6,6% | 3,6% | 0,6% |
| Solar | 0,2% | 0,2% | 0,3% |
| Candles | 0% | 0% | 26,4% |
| Wood | 23,8% | 31,8% | 0% |
| Coal | 2,6% | 3,5% | 0% |
| Animal Dung | 1,1% | 2% | 0% |
| Other | 0,2% | 0,2% | 0% |
| None | 0,3% | 11,2% | 0,4% |
| Access | Percentage |
|---|---|
| From Home | 4,5% |
| From Cellphone | 19,3% |
| From Work | 2,2% |
| From Elsewhere | 3,9% |
| No Access | 70% |
| Tenure Status | Percentage |
|---|---|
| Rented | 16,6% |
| Owned and fully paid off | 56,4% |
| Owned but not yet paid off | 10,1% |
| Occupied rent free | 12,8% |
| Other | 4% |
| Source of water | Percentage |
|---|---|
| Regional/Local water scheme (operated by municipality or other water services provider) | 64,5% |
| Borehole | 11,7% |
| Spring | 2,7% |
| Rain water tank | 0,7% |
| Dam/Pool/Stagnant water | 3,8% |
| River/Stream | 8,2% |
| Water vendor | 1,2% |
| Water tanker | 4,1% |
| Other | 3,2% |
| Toilet Facility | Percentage |
|---|---|
| None | 12,7% |
| Flush toilet (connected to sewerage system) | 40,9% |
| Flush toilet (with septic tank) | 2,8% |
| Chemical toilet | 5,2% |
| Pit toilet with ventilation | 10,2% |
| Pit toilet without ventilation | 23,6% |
| Bucket toilet | 0,5% |
| Other | 4,1% |
| Refuse Disposal | Percentage |
|---|---|
| Removed by local authority/private company at least once a week | 41,5% |
| Removed by local authority/private company less often | 1% |
| Communal refuse dump | 1,2% |
| Own refuse dump | 48% |
| No rubbish disposal | 6,3% |
| Other | 2% |
| Refuse Disposal | Percentage |
|---|---|
| Removed by local authority/private company at least once a week | 41,5% |
| Removed by local authority/private company less often | 1% |
| Communal refuse dump | 1,2% |
| Own refuse dump | 48% |
| No rubbish disposal | 6,3% |
| Other | 2% |
Quick Fact
45,1% Youth unemployment rate.
Economically the AbaQulusi area is endowed with various resources, which to date, have not yet been fully developed. To facilitate future development and growth it is essential to draw on these resources and through creative and visionary means implement measures that will result in the economic regeneration and upliftment of the population. Agriculture provides the economic base and the products produced are timber, field crops and livestock
| Employment Status | Number |
|---|---|
| Employed | 27582 |
| Unemployed | 15117 |
| Discouraged Work Seeker | 10719 |
| Not Economically Active | 70356 |
| Income | Percentage |
|---|---|
| None income | 14,7% |
| R1 - R4,800 | 5,1% |
| R4,801 - R9,600 | 9,7% |
| R9,601 - R19,600 | 22,9% |
| R19,601 - R38,200 | 20,9% |
| R38,201 - R76,4000 | 10,9% |
| R76,401 - R153,800 | 7,2% |
| R153,801 - R307,600 | 5% |
| R307,601 - R614,400 | 2,6% |
| R614,001 - R1,228,800 | 0,6% |
| R1,228,801 - R2,457,600 | 0,2% |
| R2,457,601+ | 0,2% |
| Agricultural households | |
|---|---|
| Type of specific activity | Number |
| Livestock production | 6,285 |
| Poultry production | 8,239 |
| Vegetable production | 7,800 |
| Production of other crops | 2,239 |
| Other | 1,121 |
**An agricultural household may engage in more than one agricultural activity
| Agricultural households | |
|---|---|
| Type of activity | Number |
| Crops only | 5,030 |
| Animals only | 7,568 |
| Mixed farming | 3,870 |
| Other | 369 |
**An agricultural household may not fall under more than one agricultural activity
| Income category of agricultural households | |
|---|---|
| Annual income category of agricultural household heads | Number |
| No income | 5,212 |
| R1-R4 800 | 933 |
| R4 801-R38 400 | 8,857 |
| R38 401-R307 200 | 1,288 |
| R307 201+ | 170 |
| Unspecified | 378 |
| Agricultural households municipal data per province |
|---|
| Western Cape (download) |
| Eastern Cape (download) |
| Northern Cape (download) |
| Free State (download) |
| KwaZulu-Natal (download) |
| North West (download) |
| Gauteng (download) |
| Mpumalanga (download) |
| Limpopo (download) |
**Please note that each province contains twenty five tables
Place names
Key Statistics 2011
| Total population | 211,060 |
| Young (0-14) | 36,7% |
| Working Age (15-64) | 58,6% |
| Elderly (65+) | 4,7% |
| Dependency ratio | 70,5 |
| Sex ratio | 90,9 |
| Growth rate | 1% (2001-2011) |
| Population density | 50 persons/km2 |
| Unemployment rate | 35,4% |
| Youth unemployment rate | 45,1% |
| No schooling aged 20+ | 16,9% |
| Higher education aged 20+ | 6,6% |
| Matric aged 20+ | 28,1% |
| Number of households | 43,299 |
| Number of Agricultural households | 16,838 |
| Average household size | 4,6 |
| Female headed households | 50% |
| Formal dwellings | 78,8% |
| Housing owned/paying off | 66,6% |
| Flush toilet connected to sewerage | 40,9% |
| Weekly refuse removal | 41,5% |
| Piped water inside dwelling | 38,8% |
| Electricity for lighting | 72,1% |
Key Statistics 2001
| Total population | 191,019 |
| Young (0-14) | 38% |
| Working Age (15-64) | 58,6% |
| Elderly (65+) | 4,6% |
| Dependency ratio | 73,9% |
| Sex ratio | 91,4 |
| Growth rate | 2,58% (2001-2011) |
| Unemployment rate | 59,4% |
| Youth unemployment rate | 69,2% |
| No schooling aged 20+ | 30,2% |
| Higher education aged 20+ | 6,2% |
| Matric aged 20+ | 16,1% |
| Number of households | 35,914 |
| Average household size | 5,1 |
| Female headed households | 49,5% |
| Formal dwellings | 59,3% |
| Housing owned/paying off | 52,8% |
| Flush toilet connected to sewerage | 36,4% |
| Weekly refuse removal | 35,8% |
| Piped water inside dwelling | 19,3% |
| Electricity for lighting | 43,7% |