
- Home /
- Statistics by theme /
- People - Page 5
Crime statistics
Quick Fact
Crime prevention and ultimate elimination is one of the priority goals of the National Development Plan (NDP). Crime affects all people irrespective of their background, and it is a topic that attracts a lot of media attention. Analysis will show that some groupings are affected by certain types of crime more than others. Crime statistics are essential in order to understand the temporal and spatial dynamics of crime. Such understanding is vital for planning targeted interventions and assessing progress made towards achieving a crime free nation where
“people living in South Africa feel safe at home, at school and at work, and they enjoy a community life free of fear. Women walk freely in the streets and children play safely outside”.
There are two major sources of crime statistics in South Africa, namely the South African Police Service (SAPS) and Statistics South Africa (Stats SA). The other smaller sources such as the Institute for Security Studies (ISS) and the Medical Research Council (MRC) are by no means insignificant, as they provide statistics for types of crime not adequately covered by the major players, such as domestic violence. While the methodologies used by the SAPS and Stats SA are very different, the two institutions produce crime statistics that complement each other. The SAPS produces administrative data of crime reported to police stations by victims, the public and crime reported as a result of police activity. Stats SA produces crime statistics estimated from household surveys. Crimes reported to the SAPS do not always have the same definitions as crime statistics produced from VOCS. In addition, not all crimes reported by the SAPS are reported by VOCS and vice versa. Working in close collaboration with Stats SA, the South African Police Service has undertaken to align its Classification of Crime for Statistical Purposes (CCSP) to the International Classification of Crime for Statistical Purposes (ICCS).
Highlights of the 2017/18 Victims of Crime report
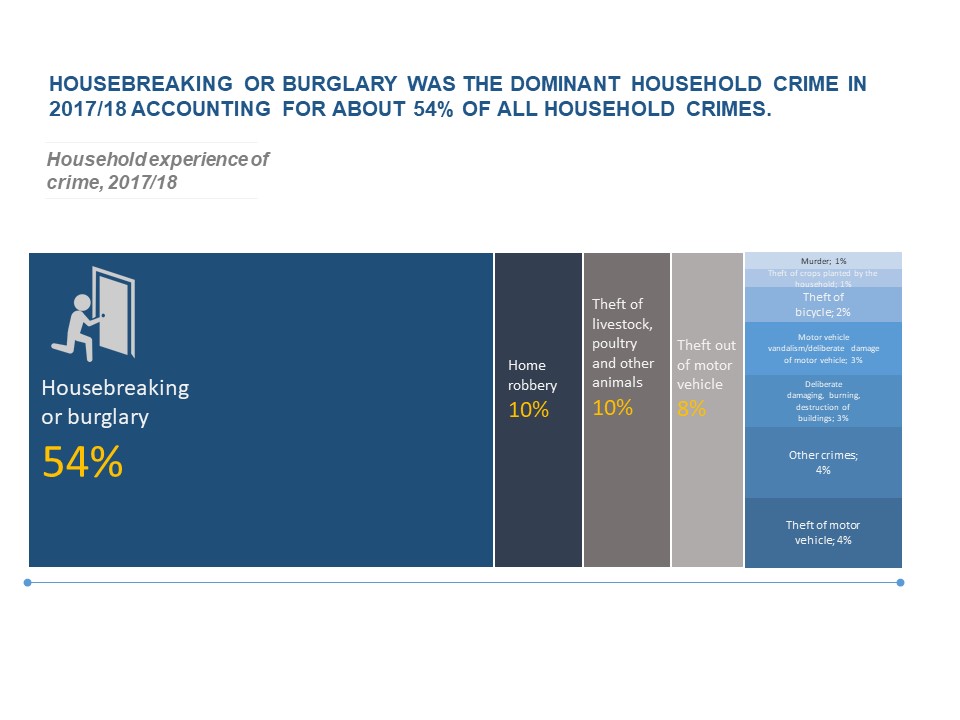
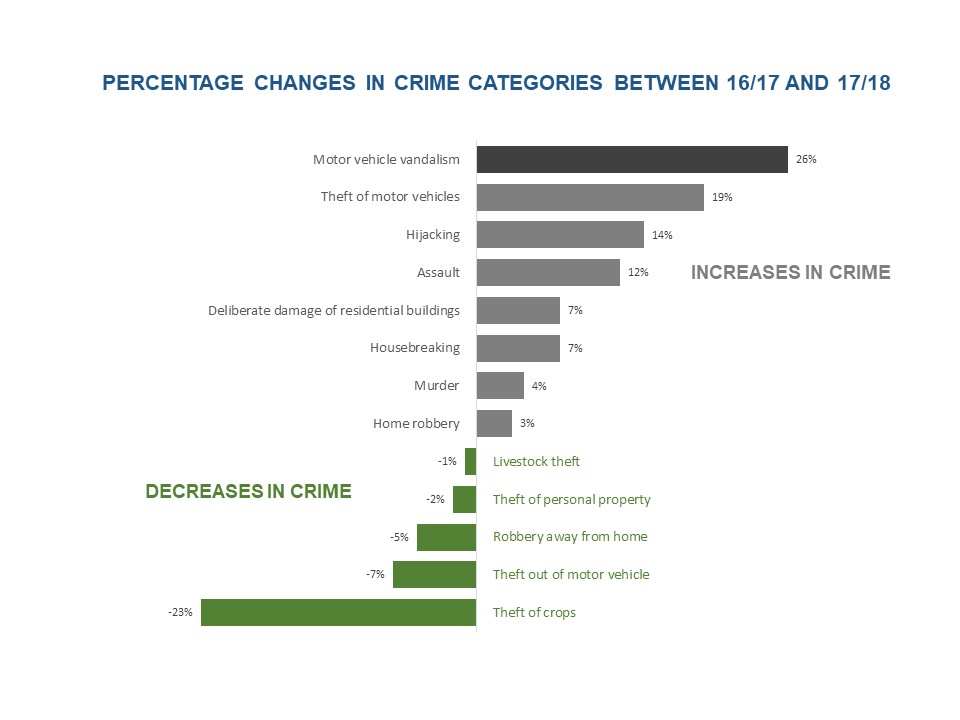
Aggregate crime levels increased in 2017/18 compared to 2016/17. It is estimated that over 1,5 million incidences of household crime occurred in South Africa in 2017/18, which constitutes an increase of 5% compared to the previous year. Incidences of crime on individuals are estimated to be over 1,6 million, which is an increase of 5% from the previous year. Aggregate household crime levels increased in Free State, KwaZulu-Natal, North West, Gauteng and Mpumalanga. Individual crime levels increased in Free State, North West and Gauteng. North West experienced a drastic increase of 80% in the individual crime level.
Perceptions of South Africans on crime in 2017/18 were more skeptical compared to the previous year. About 42% thought property crime increased during the past three years. This is an increase of 6,9% from the previous year. 46% thought violent crime increased during the past three years, an increase of 4,5% over the previous year. Western Cape was the most skeptical about crime trends, as 84% of Western Cape residents thought that crime in South African increased or stayed the same. Mpumalanga was the least skeptical among the nine provinces, where 65% thought that crime increased or stayed the same during the past three years. Crimes that are feared most are those that are most common.
An estimated 79% of South Africans felt safe walking alone in their neighbourhoods during the day, which is a decrease of 6,7% from last year. About 32% of South Africans felt safe walking alone in their neighbourhoods at night, constituting an increase of 8% from last year. The highlights for household and individual experiences of crime from the 2016/17 VOCS report are as follows:
Click on the image to enlarge

Alert: Recruitment Scam Alert
Statistics South Africa (Stats SA) has become aware of a site that is fraudulently inviting applications for positions at the organisation. Stats SA uses two platforms for recruitment – the HR Database (https://apps.statssa.gov.za/HRRecruitment/) for short-term contract positions, and the e-Recruitment platform (https://apps.statssa.gov.za/erecruitment/#/browseJobs) for permanent positions. Please do not use any other platform to apply for read more »
Key Statistics
| Percent of households that felt safe walking alone in the dark | 31.8% |
| Percentage of households who were satisfied with police in their area | 54.2% |
| Percentage of households who never saw police, in uniform and on duty, in their area of residence | 23.1% |
| Percentage of households that thought courts were too lenient to criminals | 45.6% |
| Percentage of households that are willing to welcome a former prisoner into their church/mosque | 79.6% |
| Percentage of household heads that are willing to marry a former prisoner | 22.2% |
Statistical Publications
Related Documents
Media Contact
- Sivuyile Mangxamba, Director:Media and Public Relations, Tel: +27 12 310 4732, Cell: +27 82 888 2372
- Felicia Sithole, Deputy Director:Media Relations, Tel: +27 12 339 2401, Cell: +27 76 430 0693
Subject area contacts
Economic StatsJoe de Beer (Deputy Director-General)012 310 8024 082 888 2600 joedb@statssa.gov.za Peter Perkins (Economist) 012 310 8389 082 883 9532 peterp@statssa.gov.za |
Social StatsGwen Lehloenya (Acting Deputy Director-General)012 310 8333 082 888 2323 gwenL@statssa.gov.za Neo Nghenavo (Director) 012 310 8047 082 888 2613 neon@statssa.gov.za |
| Topic | Contact | Alternative Contact |
|---|---|---|
| Consumer price index (CPI), Producer price index (PPI), Unit value indices: exports / imports, Construction materials price indices |
Patrick Kelly (Chief Director) 012 310 8290 082 888 2248 patrickke@statssa.gov.za |
Marietjie Bennett (Director) 012 310 8077 082 888 2194 marietjieb@statssa.gov.za |
| Government finance: national and provincial government | Moses Mnyaka (Chief Director) 012 310 8984 / 8586 083 471 3531 mosesmn@statssa.gov.za |
Elizabeth Makhafola (Director) 012 310 8977 082 888 9062 elizabethma@statssa.gov.za |
| Government finance: local government | Moses Mnyaka (Chief Director) 012 310 8984 / 8586 083 471 3531 mosesmn@statssa.gov.za |
Malibongwe Mhemhe (Director) 012 310 6928 082 906 8964 malibongwem@statssa.gov.za |
| Supply and use tables, Satellite accounts, Regional GDP | Michael Manamela (Chief Director) 012 310 8520 082 888 2205 michaelm@statssa.gov.za |
|
| Gross domestic product (GDP), production | Michael Manamela (Chief Director) 012 310 8520 082 888 2205 michaelm@statssa.gov.za |
Bontlenyana Makhoba(Chief Economist) 012 310 8567 bontlenyanam@statssa.gov.za |
| Gross domestic product (GDP), expenditure | Michael Manamela (Chief Director) 012 310 8520 082 888 2205 michaelm@statssa.gov.za |
Litshani Ligudu (Director) 012 310 4674 082 884 4279 litshanil@statssa.gov.za |
| Environmental-economic accounts | Gerhardt Bouwer (Chief Director) 012 310 8241 082 888 2409 gerhardb@statssa.gov.za |
Riaan Grobler (Director) 012 406 3474 084 515 2908 riaang@statssa.gov.za |
| Mining, manufacturing, electricity, capacity utilisation |
Hlabi Morudu (Chief Director) 012 310 8377 082 317 8531 hlabim@statssa.gov.za |
Nicolai Claassen (Director) 012 310 8007 076 759 0200 nicolaic@statssa.gov.za |
| Retail, wholesale, motor, land transport |
Hlabi Morudu (Chief Director) 012 310 8377 082 317 8531 hlabim@statssa.gov.za |
Keshnee Naidoo (Director) 012 310 8423 083 689 5341 keshneen@statssa.gov.za |
| Building, liquidations, civil cases for debt, food & beverages, tourist accommodation |
Hlabi Morudu (Chief Director) 012 310 8377 082 317 8531 hlabim@statssa.gov.za |
Joyce Essel-Mensah (Director) 012 310 8255 082 888 2374 joycee@statssa.gov.za |
| Annual financial statistics (AFS) | Sagaren Pillay (Chief Director) 012 310 4619 082 905 2665 sagarenp@statssa.gov.za |
Amukelani Ngobeni (Director) 012 310 2938 082 677 4536 amukelanin@statssa.gov.za |
| Quarterly financial statistics (QFS) | Sagaren Pillay (Chief Director) 012 310 4619 082 905 2665 sagarenp@statssa.gov.za |
Krisseelan Govinden (Director) 012 310 4651 082 901 7960 krisseelang@statssa.gov.za |
| Structural industry statistics (large sample surveys of industries every 3 to 5 years; agriculture) |
Itani Magwaba (Chief Director) 012 337 6471 / 6254 082 905 5143 itanim@statssa.gov.za |
Tshepo Pekane (Director) 012 310 8191 083 675 8654 tshepop@statssa.gov.za |
| Population Statistics (Census and Community Survey) | Christine Khoza (Chief Director) 012 310 2185 071 670 2672 christinek@statssa.gov.za |
Angela Ngyende (Chief Statistician) 012 310 4699 079 519 3212 angelan@statssa.gov.za |
| Demography-Mid-year Population Estimates | Diego Iturralde (Chief Director) 012 310 8922 082 413 2661 diegoi@statssa.gov.za |
Chantal Munthree (Chief Statistician) 012 310 6648 082 888 2289 chantalMu@statssa.gov.za |
| Labour Statistics- Quarterly Labour Force Survey (QLFS) | Malerato Mosiane (Acting Chief Director) 012 310 8688 082 888 2449 maleratoM@statssa.gov.za |
Desiree Manamela (Director) 012 310 2145 071 681 2768 DesireeM@statssa.gov.za Malerato Mosiane (Chief Statistician) 012 310 8688 082 888 2449 maleratoM@statssa.gov.za |
| Quarterly Employment Statistics (QES) | Malerato Mosiane (Acting Chief Director) 012 310 8688 082 8882449 maleratoM@statssa.gov.za |
Matlapane Masupye (Acting Director) 012 310 8168 082 317 5340 matlapanem@statssa.gov.za |
| Tourism Statistics (Domestic Tourism Survey) | Isabel Schmidt (Chief Director ) 012 337 6379 082 884 4281 IsabelSc@statssa.gov.za |
Brenda Mosima (Director) 012 310 8168 082 906 7925 BrendaMo@statssa.gov.za |
| Crime and Safety Statistics (Victims of Crime Survey) | Isabel Schmidt (Chief Director ) 012 337 6379 082 884 4281 IsabelSc@statssa.gov.za |
Joseph Lukhwareni (Director) 012 310 8485 082 888 2486 JosephL@statssa.gov.za |
| Service Delivery Statistics (General Household Survey) | Isabel Schmidt (Chief Director ) 012 337 6379 082 884 4281 IsabelSc@statssa.gov.za |
Niel Roux (Director) 012 310 2939 082 904 7919 NielR@statssa.gov.za |
| Transport Statistics (National Travel Survey) | Isabel Schmidt (Chief Director ) 012 337 6379 082 884 4281 IsabelSc@statssa.gov.za |
Solly Molayi (Director) 012 310 6442 083 440 7035 SollyMol@statssa.gov.za |
| Gender Statistics | Isabel Schmidt (Chief Director ) 012 337 6379 082 884 4281 IsabelSc@statssa.gov.za |
Tshepo Mabela (Director) 012 310 8587 082 941 9383 TshepoMab@statssa.gov.za |
| Mortality and Causes of Deaths | Rika du Plessis (Acting Chief Director) Health and Vital Statistics 012 310 2913 .. rikaDP@statssa.gov.za |
Thabo Molebatsi(Director) 012 310 4857 060 997 8372 thabomol@statssa.gov.za |
| Tourism and Migration | Rika du Plessis (Acting Chief Director) Health and Vital Statistics 012 310 2913 .. rikaDP@statssa.gov.za |
Ramadimetja Matji(Director) 012 406 33011 071 670 3272 ramadimetjaM@statssa.gov.za |
| Registered Births | Rika du Plessis (Acting Chief Director) Health and Vital Statistics 012 310 2913 .. rikaDP@statssa.gov.za |
Thabo Molebatsi(Director) 012 310 4857 060 997 8372 thabomol@statssa.gov.za |
| Marriages and Divorces | Rika du Plessis (Acting Chief Director) Health and Vital Statistics 012 310 2913 .. rikaDP@statssa.gov.za |
Ramadimetja Matji(Director) 012 406 33011 071 670 3272 ramadimetjaM@statssa.gov.za |
| Living Conditions Survey | Rika du Plessis (Acting Chief Director) Health and Vital Statistics 012 310 2913 .. rikaDP@statssa.gov.za |
Thabo Molebatsi(Director) 012 310 4857 060 997 8372 thabomol@statssa.gov.za |
| Income and Expenditure Survey | Nozipho Shabalala (Chief Director ) 012 310 6994 082 904 8896 Noziphos@statssa.gov.za |
Werner Ruch (Director) 012 310 6318 082 906 7967 wernerr@statssa.gov.za |
My Municipality
Careers
| © Statistics South Africa | Access to information | Disclaimer |